Experiment on Spot Size Ratio and calculations

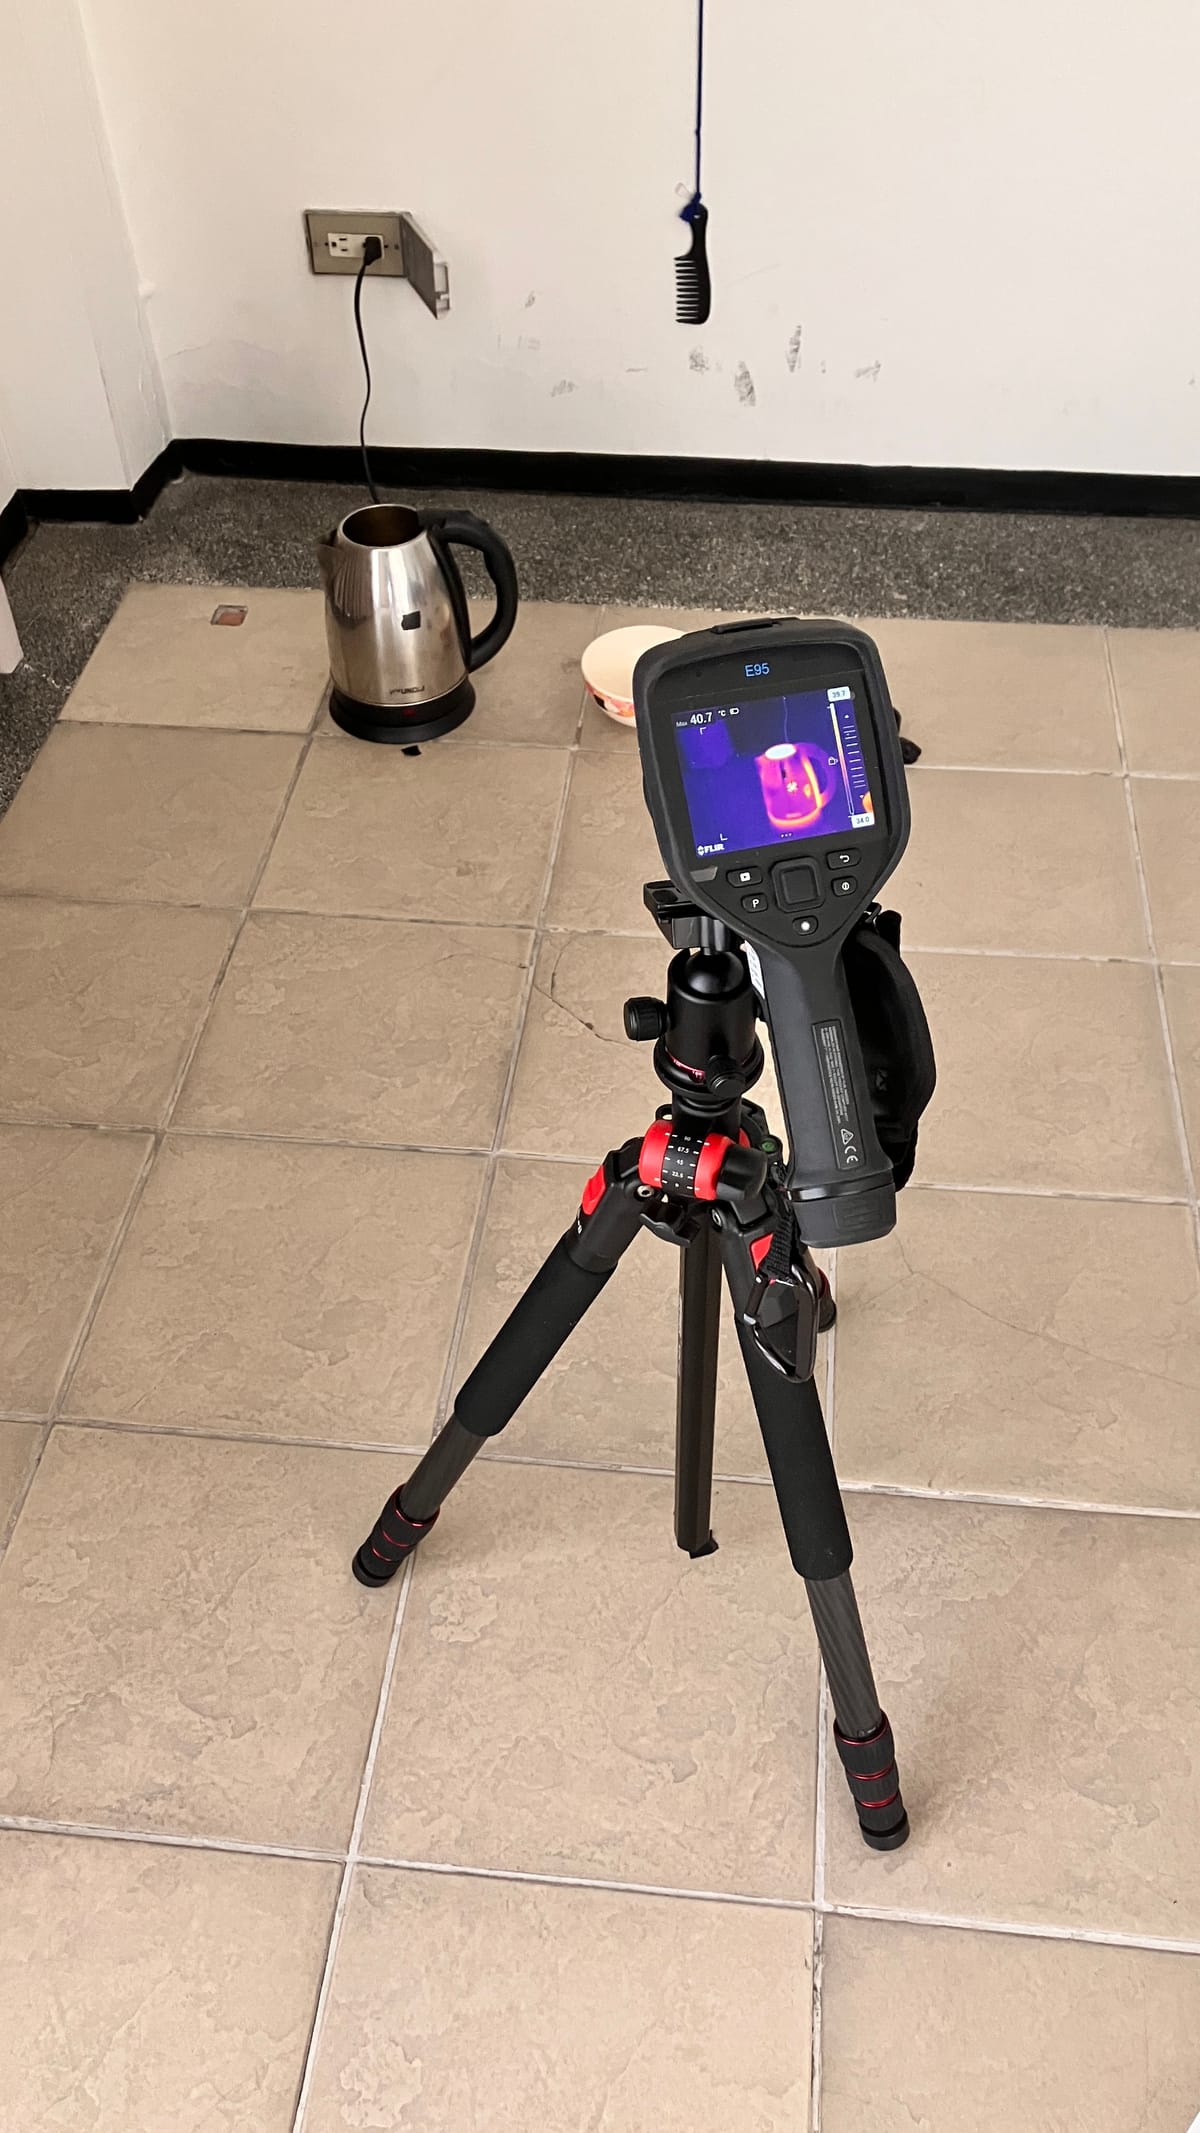
I've done this experiment a couple of times but didn't systematically record numbers. Spot Size Ratio is something that is thrown around but most thermographers don't know how to calculate it, let alone know the formula.
Here are the items I used for this experiment:
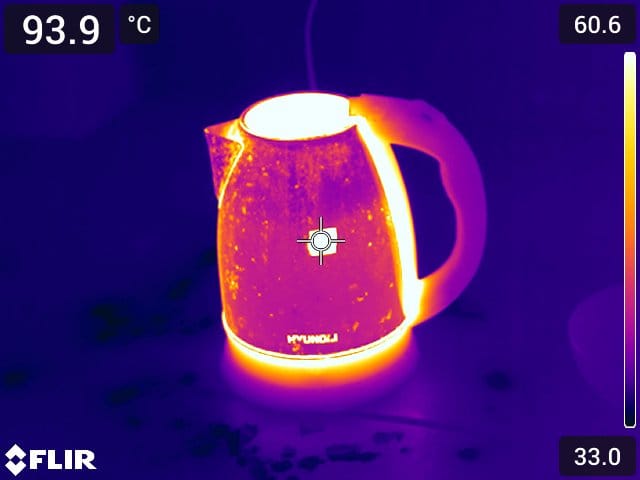
thermal camera w/ tripod, a electric kettle, electric tape, and a measuring tape.
Here are the steps:
1) Put tape on kettle
2) Put 100cm distance markers (for a total of 1100cm)
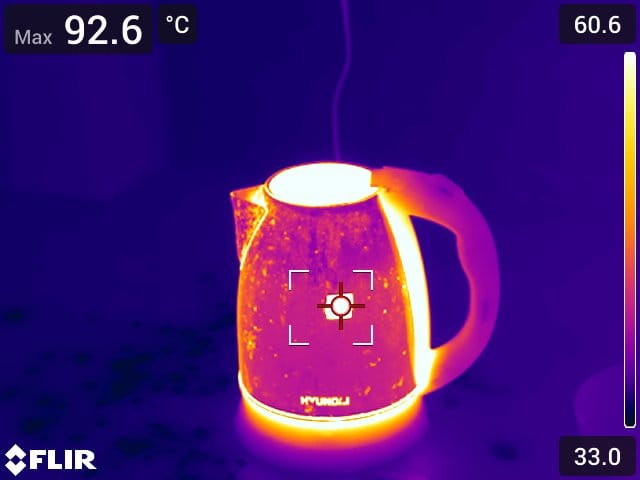
3) Warm up the kettle till 100degC
4) Adjust the hot spot box to narrow in on kettle tape
5) Capture an image for each marker and record temperature
6) Repeat the process using only the cross-hairs
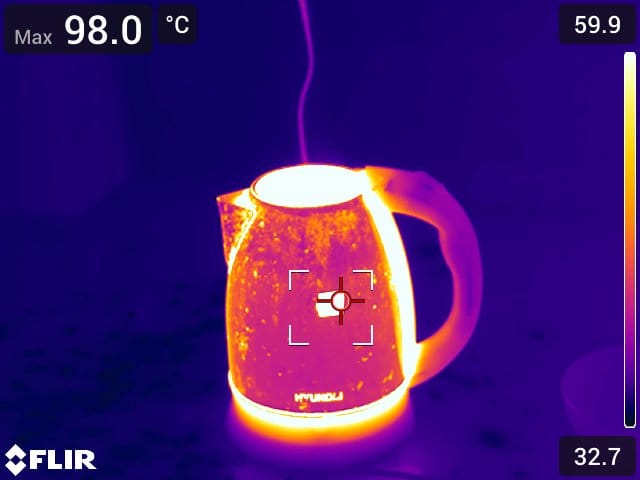
What I noticed is that the kettle could only reach maximum temp of 98.8degC. The kettle is an open top kettle (the top is broken) and the energy escaping as it boils is the limiting factor. I also set the camera emissivity to 0.95. Ambient temp was about 35degC.
This experiment has two parts. One is to measure the temperature at each distance using the hot spot mode. The other part is to use the cross hairs. I knew from the start that the cross hairs would give me an undeniable lower temperature reading because it is taking 16pixels and averaging the temperature while the hot spot mode is measuring the hottest spot for a single pixel.
Here, I'll provide the visuals first and then provide a table with the numbers.
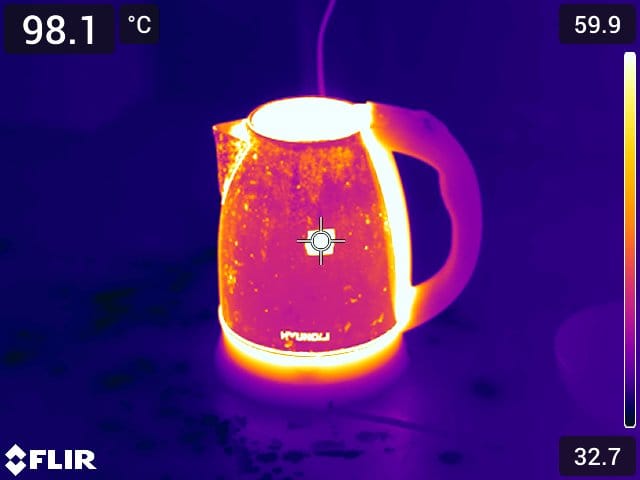
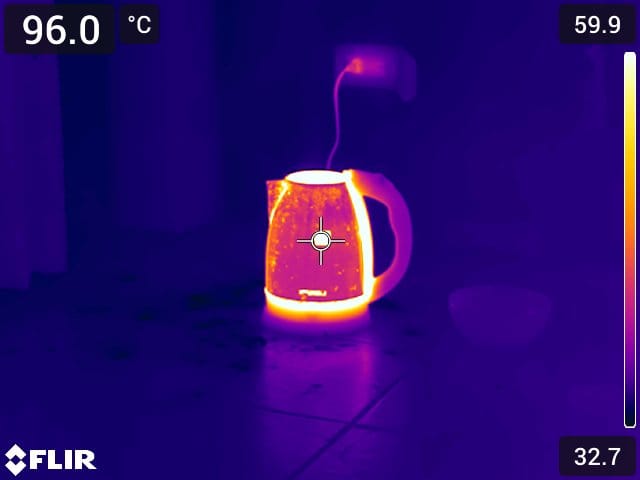
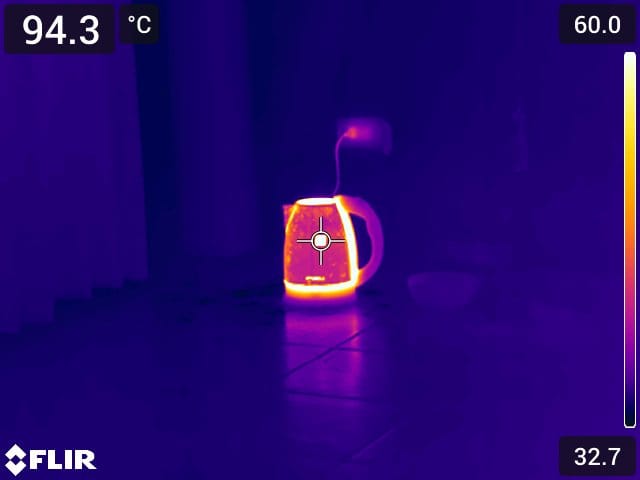
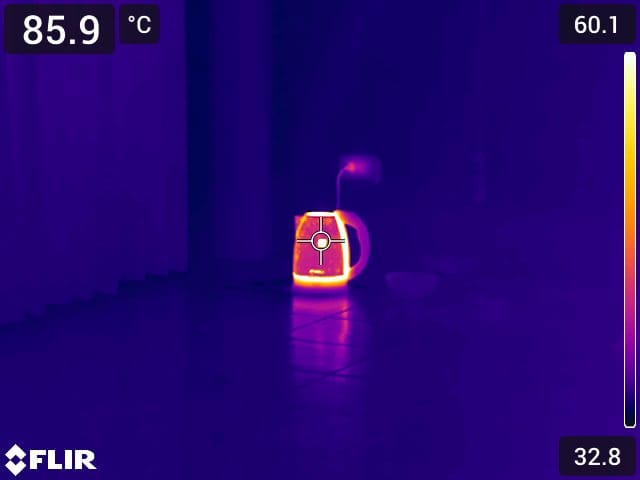
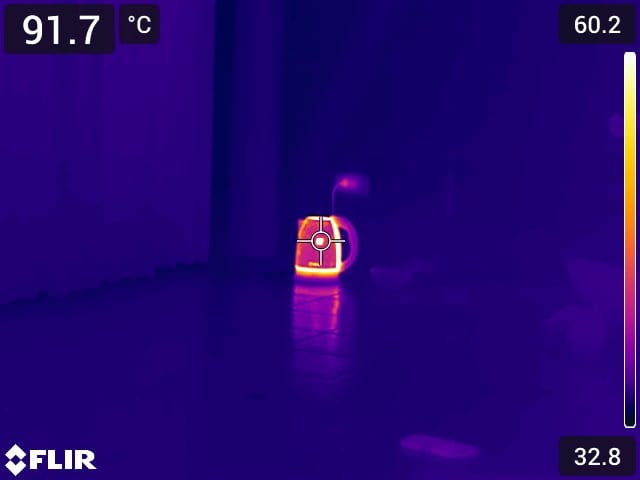
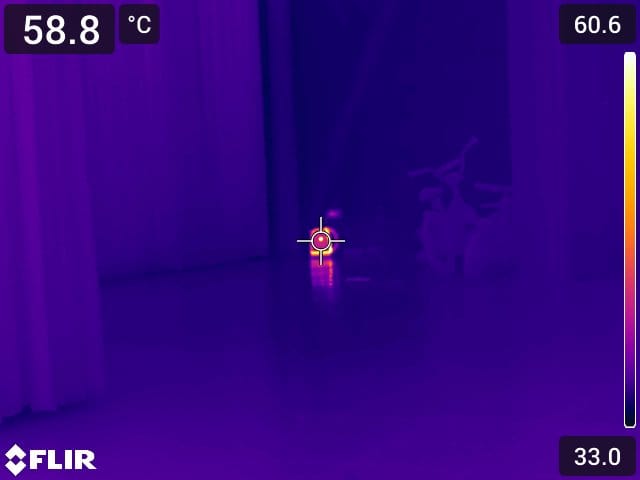
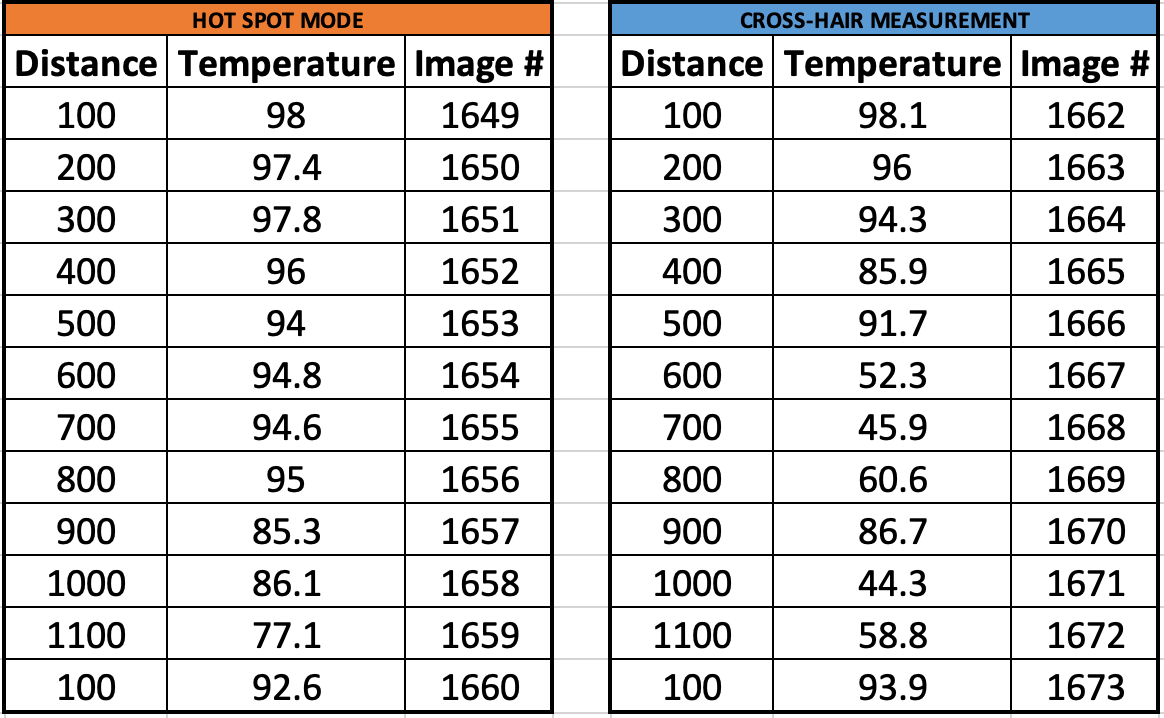
This is using the Hot Spot method:
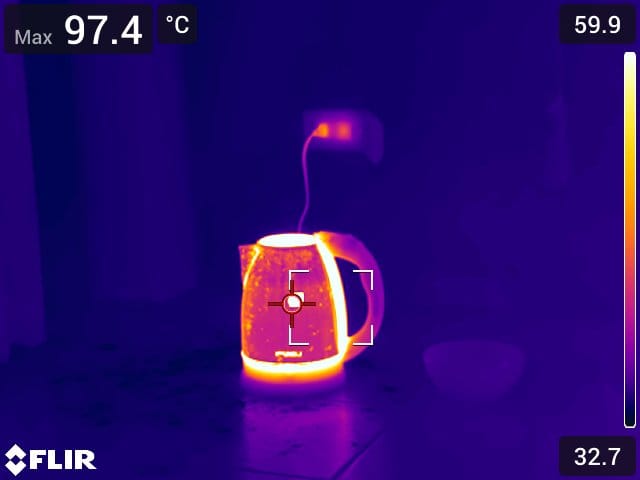
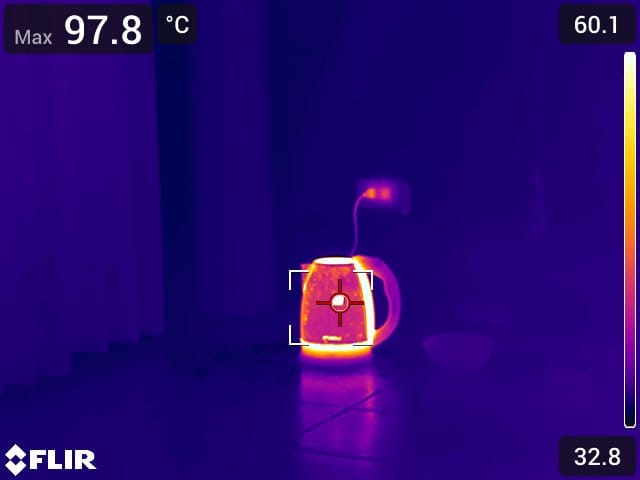
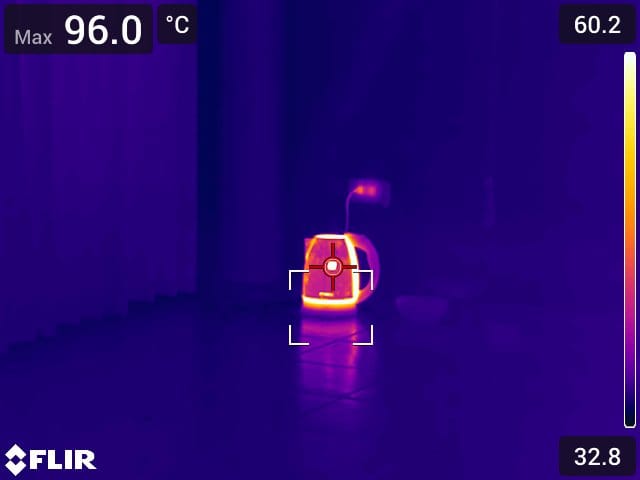
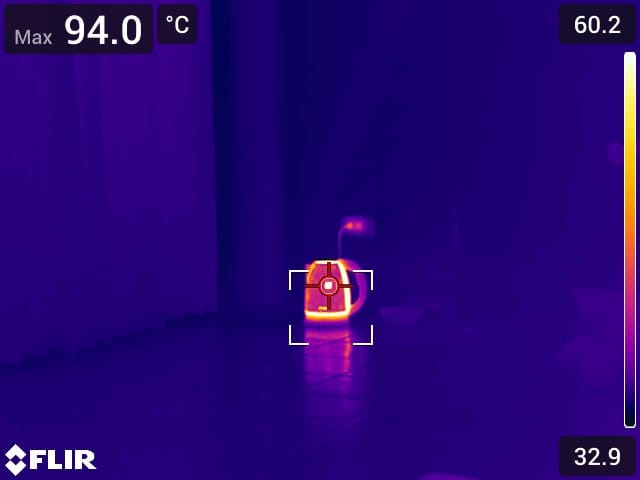
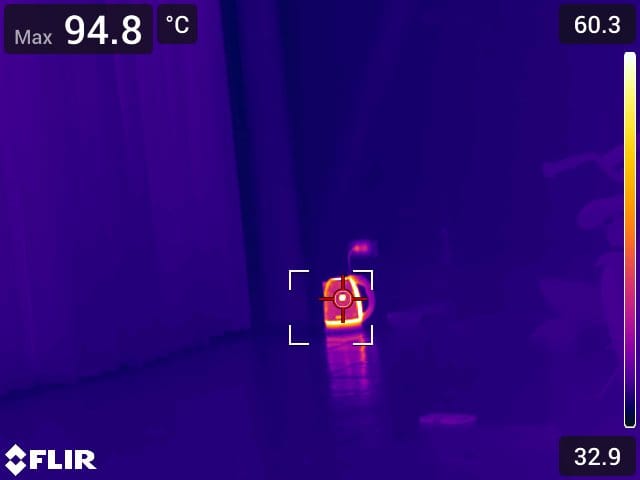
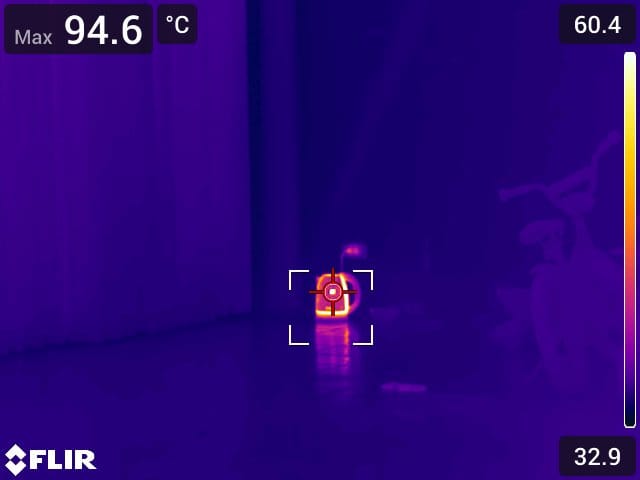
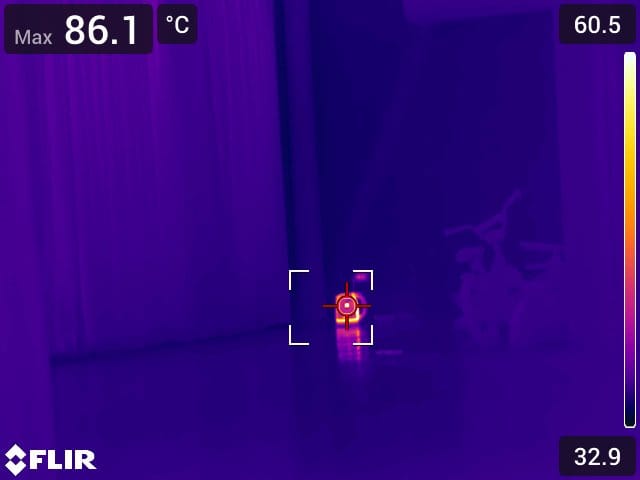
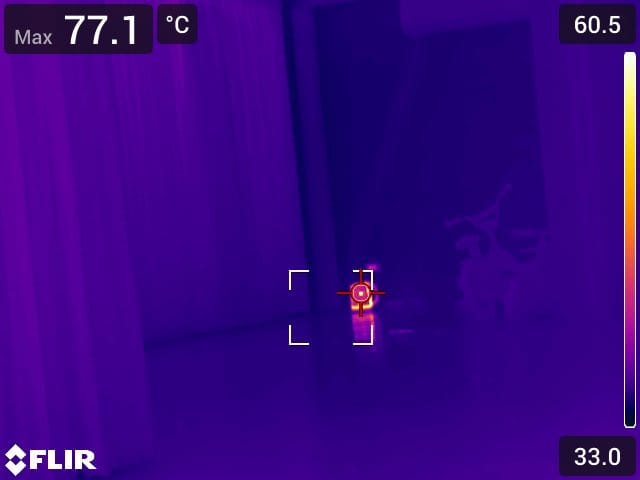
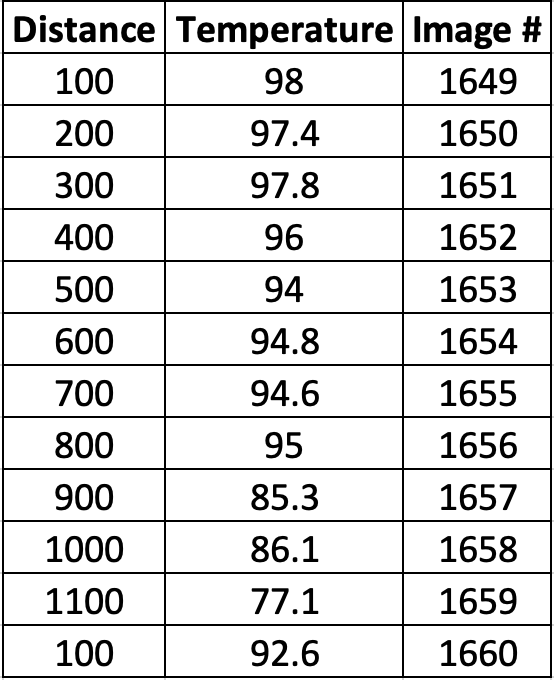
The kettle lost 5.5degC of energy for the time it took me to conduct the experiment. It appears that the hot spot was able to maintain a relatively accurate measurement up to 800cm (8 meters). Then there is a precipice drop of 10degC and ultimately down to 77degC at 1100cm (11 meters).
Which means that at 11 meters there is a difference of roughly 15.5degC (92.6-77.1) for the Hot Spot mode.
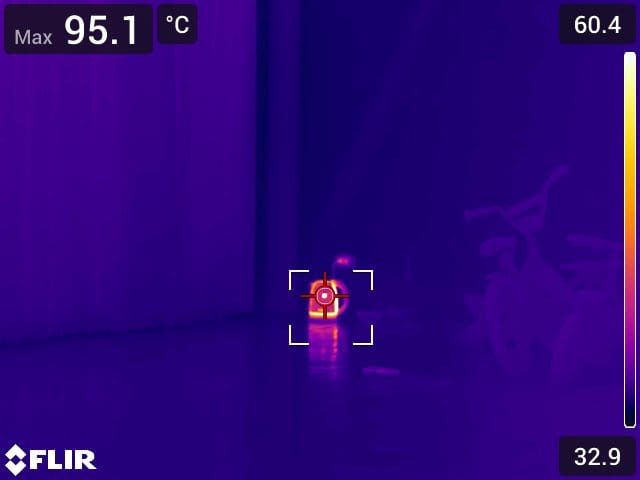
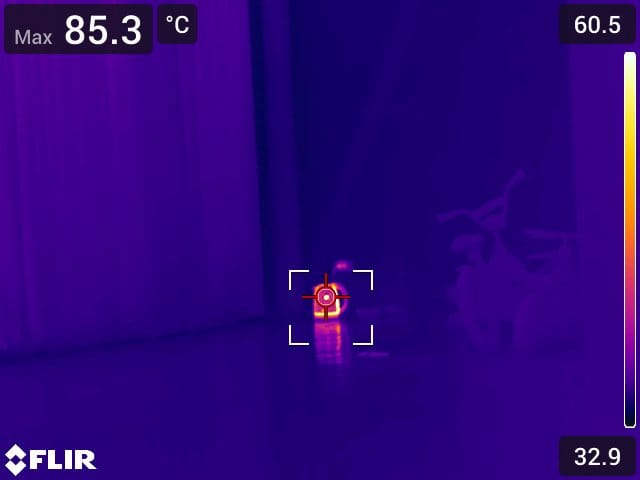
Now the Cross-hair measurements.
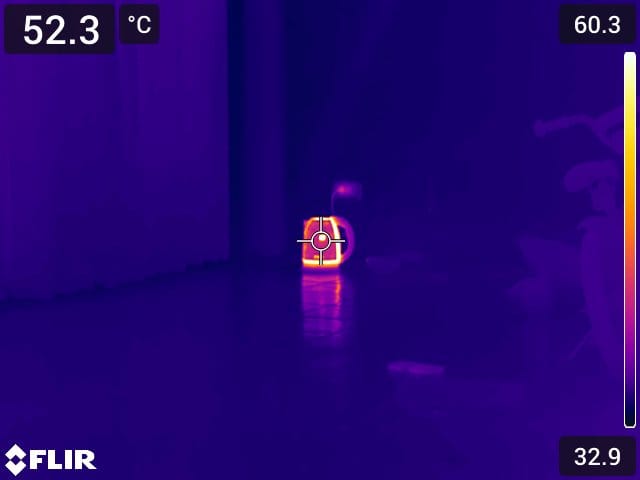
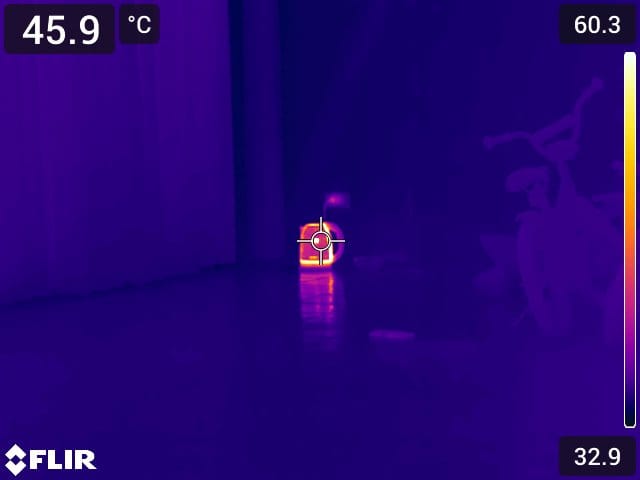
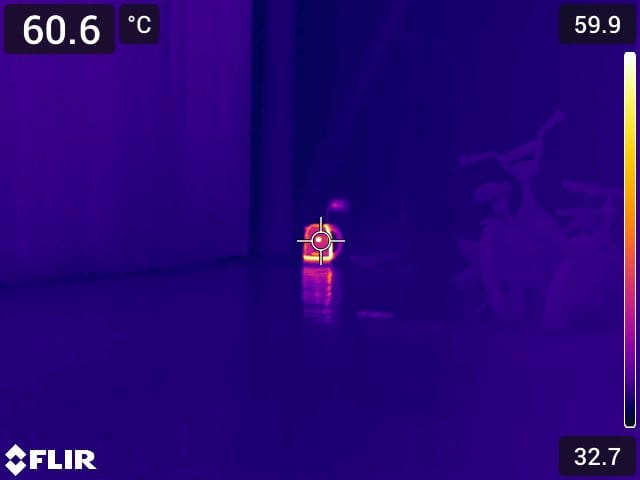
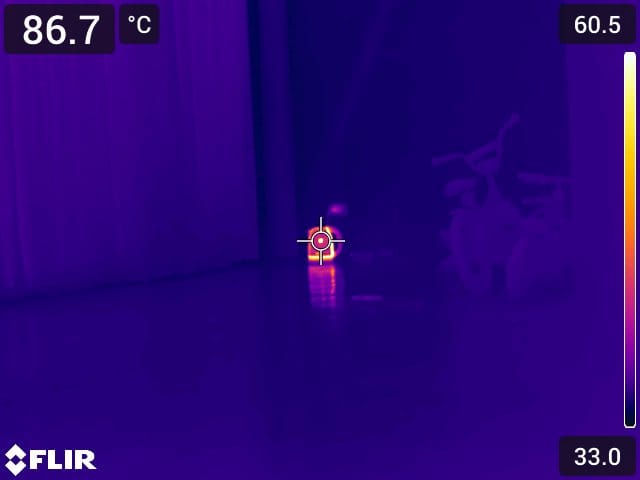
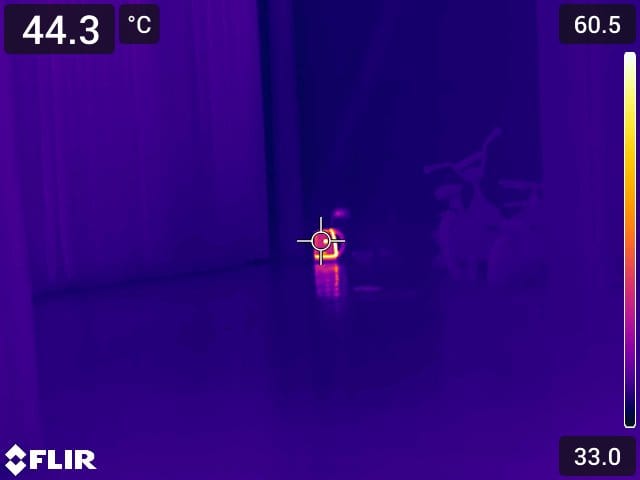
You can see a big drop after 400cm (4 meters). After 400cm the measurements become more varied. This has a lot to do with camera stability and the kettle itself.
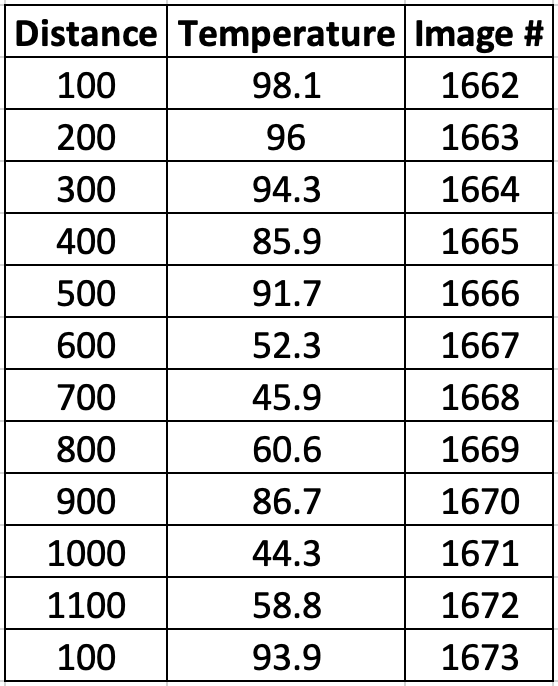
The farther you go the more of the kettle is in the cross-hairs because the kettle is getting smaller. As it gets smaller, I am also capturing (or getting more pixels) the handle as well as the bottom which are emitting more thermal energy. If your holding position of the thermal camera is jittery, your cross-hairs will not be on target. But the right of the two images, you can see that I am getting more pixels on the environment around the kettle which is dropping the apparent temperature to 44.3degC.
So in the end, there was a 5degC drop from the beginning of the experiment to the end and the lowest measured temperature with the cross-hairs was 44.3degC compared to the Hot Spot Mode with the lowest temp being 77.1degC.
Here are the measurements side by side:
SPOT SIZE RATIO CALCULATIONS